
In our first article we discussed cloud sustainability in general terms, looked at the AWS carbon footprint dashboard, and asked a few general questions to help discover opportunities for being more sustainable when designing cloud workloads.
Of course – the simplest way to improve your sustainability is to move workloads to renewably powered regions. While there’s a potential trade off here between latency and sustainability, the mechanics of the decision are pretty simple.
Alongside using more sustainable regions, the overall reduction of energy consumption is a key area of opportunity for driving sustainability. This is where the decisions start to get a bit more complicated, as the specifics of your workloads start to matter.
Where to start?
To kick off – we need a framework to look at the decision through. We will work empirically and experiment our way toward reduction, but having a general understanding of where and how the energy is spent will help us frame our strategy and prioritise our investments more effectively.
It’s worth noting that we’re not looking for a high precision model here, just a way to compare one idea to another – a heuristic, to guide our decision making. To get there we’ll work through categorising our workloads generally, then working through a set of more detailed questions to identify opportunities for improvement. The way we’ll do this is:
- Set up a data capture and analysis capability
- Categorise the types of workloads we have
- Identify workload energy drivers
- Establish reduction hypotheses
- Prioritise by impact
- Action reductions and re-assess our priorities based on performance change
While the Carbon Footprint reporting within the Cost and Usage Reports is a good roll up overview, unfortunately it doesn’t provide a workload by workload breakdown of the services driving the carbon footprint. To start making good quality decisions we need a little bit more insight.
Establishing a data driven decision capability
Fortunately, it’s pretty simple to get an idea of what energy you’re using and where you’re using it. To begin, let’s switch on some more granular data capture. Head over to the AWS Billing dashboard for your management account and click on Cost and Usage reports. Right at the top you’ll see a ‘Create Report’ button, which is your key to unlocking detailed reporting data.
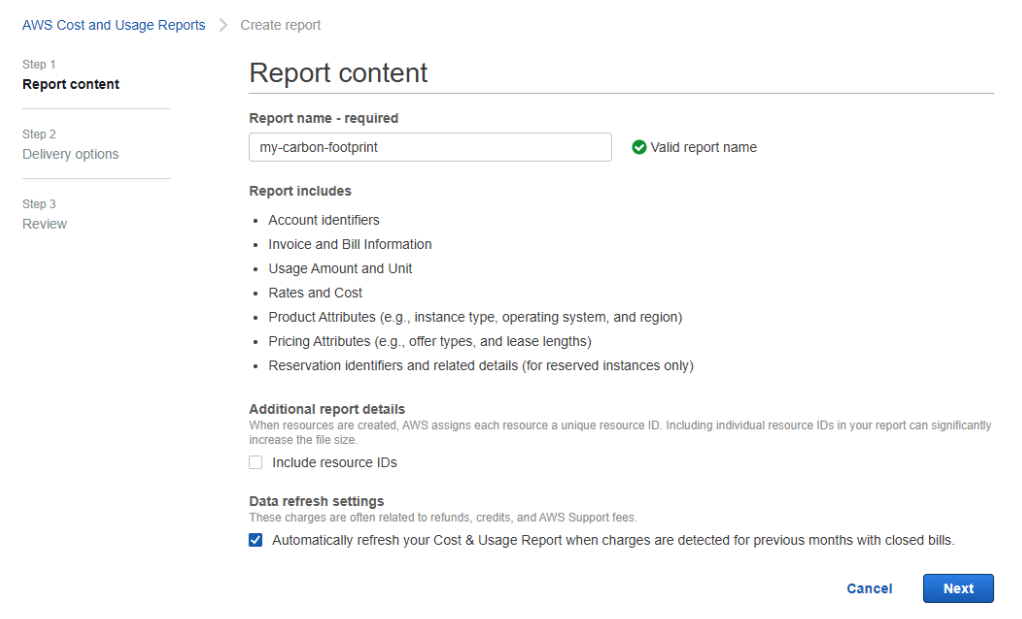
Report configuration is pretty simple, with a great article over at Creating Cost and Usage Reports – AWS Cost and Usage Reports (amazon.com) that will walk you through each of the options. You’ll specifically need to enable Athena integration, so you’re set for the later steps.
Analysis and visualisation
Once you’ve got your data collection started, we’re going to need a way to analyse it. Of course, we could build a set of custom queries using an assumed cost model for carbon production across each resource type. Alternatively – we could use the open source Cloud Carbon Footprint estimation tool. A relatively simple to configure node.js application that does a lot of the heavy lifting for you across your cloud accounts.
Configuring the tool takes a few steps – which if you’re comfortable with Terraform, CloudFormation or Docker, are simplified by the presence of existing TF, CF and Docker compose scripts.
Once up and running, you’ll get much more granular insight into the drivers of your carbon footprint. You can then start to categorise your workloads more usefully – what’s really driving that footprint?
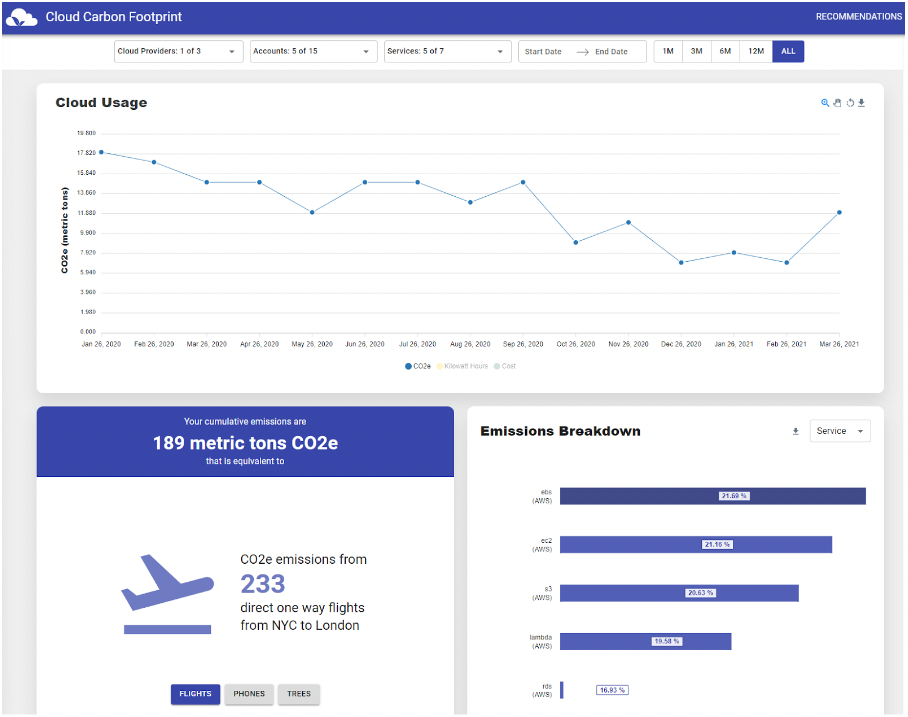
Using the tool we can quickly triage our workloads into the macro buckets of compute, storage or network driven consumption. We do this through filtering to the accounts the workload is associated with, and the services that it uses. This gives us a clearer picture of what is driving the energy usage, and allows us to narrow down the types of questions we need to ask to help achieve more sustainable workloads.
In a few quick steps we’ve gone from wanting to improve our carbon footprint to having the data to develop a useful hypothesis about how we might take action. Setting up the data capture across our AWS services, then leveraging the Cloud Carbon Footprint to understand it. In our next article we’ll look at how we take action based on the data – by considering the improvement in performance of a data driven workload, and what design options you should consider when you’ve got sustainability in mind.